Profiling Runtime Workbenches
(Click to enlarge)
Select the Profiled Runtime Workbench
type in the left pane and press the New
button. This will create a new profiled runtime workbench launch configuration.
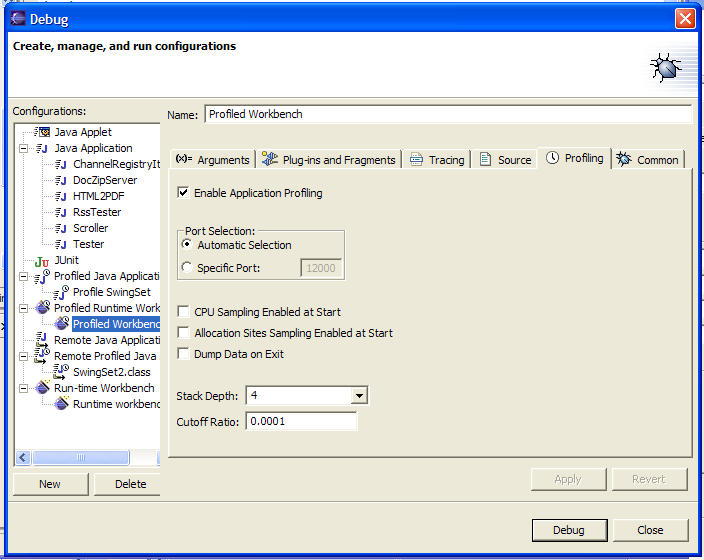
Profiling Configuration Tab
When a profiling launch configuration is selected in the left
pane, a Profiling configuration
tab is made available for making adjustments to the launch configuration.
Enable Application Profiling
Use this selection to control whether profiling of the application will
be done when running via this launch configuration. The default
for a profiling launch configuration is for profiling to be enabled.
Port Selection
Use the port selection controls to adjust how the profiler will
communicate with the application being profiled.
CPU Sampling Enabled at Start
When selected, the profiler will begin recording information about the
methods being executed as soon as the application is launched. Use
the CPU Snapshots view to display the
collected data.
Allocation Sites Sampling Enabled at Start
When selected, the profiler will begin recording information about heap
allocations and the location within the code that the allocations occur
as soon as the application is launched. Use the Heap Allocation Sites view to display
the collected data.
Dump Data on Exit
When selected, all collected data will be dumped to the profiler when
the application exits. If profiling in Run mode, you must have this option
selected for any data to be collected.
NOTE:
In certain circumstances when large amounts of data must be dumped on
exit, the profiled application may close the connection before all data
has been transferred. In these cases, set a breakpoint in your
application just before application exit and perform a manual request
for the data of interest.
Stack Depth
Use the stack depth selection to control the number of stack frames
that will be collected for CPU Sampling and Heap Allocation sites.
The larger the stack depth, the more information that will be
provided. Large stack depths take more memory during data
collection.
Cutoff Ratio
Use the cutoff ratio to control the stack frames included in the data.
The cutoff ratio defines the threshold under which stack frames
will not be included. If the stack frame contributes less than the
cutoff ratio to the overall cost, it will not be included.
Set Filter...
Press the "Set Filter..." button to access the filter
selection dialog. Use the filter selection dialog to specify
the initial filter settings for captured CPU Snapshots and Heap
Allocation Sites. When snapshots are taken, the initial filter
will be inherited from launch configuration. Changes made to the
filtering within the views will not change the value held in the launch
configuration.
A Note on Memory
The collection of profiling data takes place within the application
being profiled. This data takes extra memory above and beyond that
used directly by your application. Make sure that the profiled
application has enough memory available to hold the application data and
profiling data. The -Xms
and -Xmx JVM parameters may be
used to specify extra memory be available from via the Arguments tab of the launch
configuration. In addition, the Java process in which Eclipse is
running will also require large amounts of memory for collected data.
Use the -vmargs
command-line parameter to Eclipse along with -Xms and -Xmx to give Eclipse the necessary
heap space.