Viewing Heap Allocation Sites
To better understand the the location at which objects are being
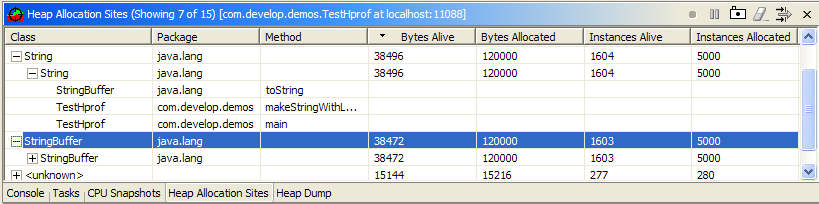
allocated, use the Heap Allocation Sites View. This view will show
the location of heap allocations and allow sorting to pinpoint the most
costly sites of object allocations in your application.
(Click to enlarge)
View Data
The view data includes information about the allocations made by your
application. Snapshots may be taken at any point in your application and
snapshot data may be cleared as well. The data shown is organized in a
tree view as follows:
- Accumulated allocations for a particular type
- Accumulated allocations for a particular type at a particular
site
- Stack trace leading up to the site of the object allocation
Each of the columns displays information about the object allocations
that were made at at what location in the application. These
columns include the bytes allocated versus bytes still alive and the
instances allocated versus instances that are still alive.
In addition to the toolbar and menu actions, the view supports the
following:
- The data in the view may be sorted by selecting the column
headers.
- A source code editor may be opened by double-clicking on any row
displaying a stack frame.
View Toolbar Items
The toolbar items may be used to control the heap allocation sites
sampling and snapshots.
 Start Sampling
The start sampling item will begin recording of heap allocation sites
samples.
 Pause Sampling
The pause sampling item will pause recording of heap allocation sites
samples.
 Take Snapshot
The take snapshot item will take a snapshot of the currently recorded
heap allocation sites samples and display the results in the view.
 Clear Samples
The clear samples item will request the profiled application to clear
any heap allocation sites samples that have been collected up to this
point.
 Filter Samples
Choose the filter action to filter out heap allocations that you would
prefer to ignore. The title bar reflects the current number
of heap allocations displayed versus the number of allocations available
in the snapshot. If all stack frames in a stack trace are
currently filtered, the heap allocations for that trace will be omitted
from the view.
For more information on filtering see the information on filtering.