Taking CPU Samples
To better understand the time being spent in your application, use the
CPU samples view. Using this view, a snapshot may be taken to find out
what methods are taking time in your application.
(Click to enlarge)
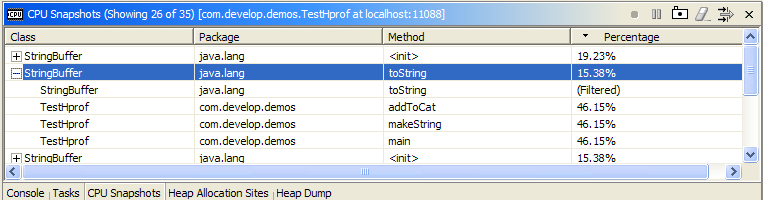
View Data
The view data includes information about the most expensive parts of
the application as captured by the snapshot. Snapshots may be taken at
any point in your application and snapshot data may be cleared as well.
The data shown is organized via stack trace with the stack frames that
make up the trace shown as children.
The percentage field shows the percentage of times that the
specified stack trace or stack frame were active of the total number of
samples taken.
In addition to the toolbar and menu actions, the view supports the
following:
- The data in the view may be sorted by selecting the column
headers.
- A source code editor may be opened by double-clicking on any row
displaying a stack frame.
View Toolbar Items
The toolbar items may be used to control the CPU sampling and
snapshots.
 Start Sampling
The start sampling item will begin recording of CPU samples.
 Pause Sampling
The pause sampling item will pause recording of CPU samples.
 Take Snapshot
The take snapshot item will take a snapshot of the currently recorded
CPU samples and display the results in the view.
 Clear Samples
The clear samples item will request the profiled application to clear
any CPU samples that have been collected up to this point.
 Filter Samples
Choose the filter action to filter out CPU Samples that you would
prefer to ignore. The title bar reflects the current number
of CPU samples displayed versus the number of samples available in the
snapshot. Stack frames that are currently filtered will
display (Filtered) in
the Percentage column. If all stack frames are currently
filtered, the entire stack trace will be omitted from the view.
For more information on filtering see the information on filtering.