Profiling Using jMechanic
Launching a Profiled Application
To begin profiling your application using the jMechanic plugin, create
a profiling launch configuration. Select the class to be profiled
in Eclipse. With the appropriate class selected, choose Run... or Debug... from the Run menu. A dialog similar to
the following will be displayed.
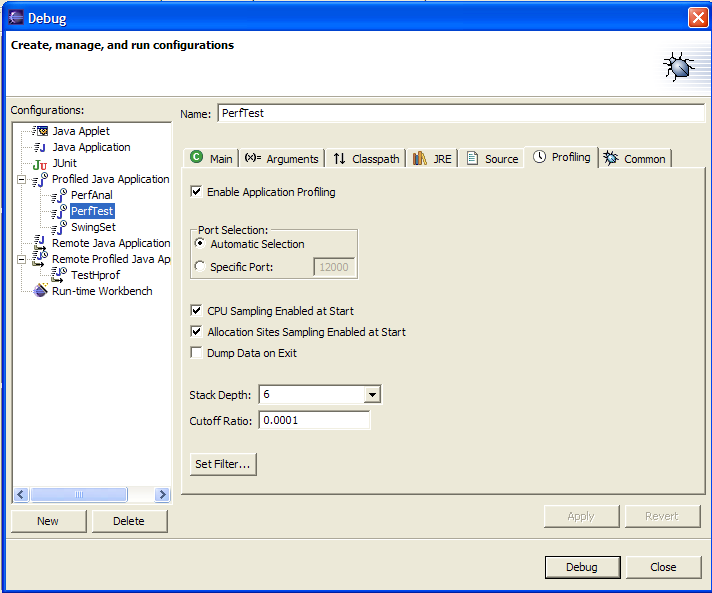
(Click to enlarge)
Select the Profiled Java Application,
Remote Profiled Java
Application or the
Profiled Runtime Workbench type in the left pane and press the New button. This will create a
new profiled Java application launch configuration for the selected
application class.
Profiling Views
jMechanic provides a number of views to help you understand the
performance of your Java application. These views may be opened by
selecting Show View from the Window menu. The views can be
found under the Profiler
category when selecting Other...
from the Show View menu.
The following views are available in this release of jMechanic:
Profiling Jakarta Tomcat Web Applications
Although there is not yet specific support in jMechanic for profiling
Tomcat Web Applications, it is possible to set up a standard Profiled
Java Application to execute a Web Application. This assumes that
the Sysdeo Tomcat plugin is already installed in your Eclipse
environment. To profile a web application, set your launch
configuration to include the following settings.
Main Tab
Project: Your web
application
Main Class:
org.apache.catalina.startup.Bootstrap
Arguments
Program Arguments: start
VM arguments: -Dcatalina.base=<tomcat directory>
-Dcatalina.home=<tomcat
directory>
Classpath
Use default class path: Deselected
User classes:
- Add "/bin/bootstrap.jar" relative to the TOMCAT_HOME variable using Advanced... Add Variable... Extend...
- Add "tools.jar" from the launch configuration JRE. Choose Add External Jar... and locate <JRE_HOME>/lib/tools.jar