Viewing the Objects in the Heap
With the exception of primitive types, all objects in Java are
allocated and held in a large area of memory referred to as the heap.
The garbage collector within the JVM is responsible for making
unused memory within the heap available to applications. This
process requires time and processor power. In addition,
inadvertant object references in an application, can cause heap objects
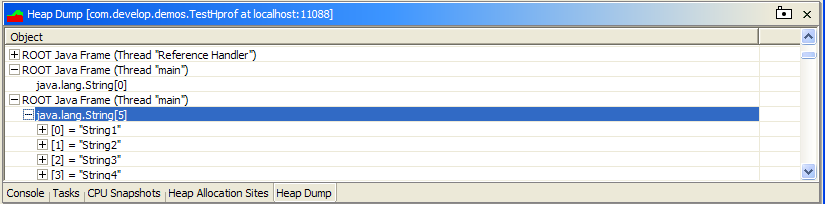
to be held when no longer necessary. The heap dump view provides
insight into the current contents of the heap of the running application.
At this time, the view provides a tree view showing the relationships
between the heap objects. If unintended references are found in
this view, alter the application to remove those references when no
longer necessary.
(Click to enlarge)
Workaround for JDK bug 4719788
The heap dump view will not work with versions 1.4.x of the JDK prior
to 1.4.2. Bug 4719788 (more information available at http://developer.java.sun.com/developer/bugParade/bugs/4719788.html)
documents a change that was made to the HPROF profiler interface that
breaks the binary data exchange used by jMechanic. The official
bug fix is slated to be fixed in "mantis" (version 1.4.2) to be
released
in "early 2003".
In the meantime, it appears that versions of the hprof library from
1.3.x releases work with the newer JDK. A possible workaround is
to replace the 1.4.x versions of the hprof library with the most recent
version from 1.3.x. To do this on the Win32 platform:
- Locate all of the instances of 1.4.x "hprof.dll". (For
instance in JDK and JRE directories).
- Rename these DLLs by appending ".bak" to them.
- Copy the 1.3.x "hprof.dll" into these locations.
Although this technique was used during the development of the heap
dump view, making such a change is done at your own risk. Other
options include profiling using a 1.3.x JDK or waiting until the Mantis
release arrives.
View Data
The view data includes the objects currently held in the heap.
Snapshots may be taken at any point while running your application.
In order to give the most accurate information, the JVM will
perform a collection of unreferenced objects before providing the heap
data. The data shown is organized in a tree view. Each root object within the heap displays
at the root of the tree view. All objects being held in the heap
are directly or indirectly referenced via one of the root objects.
At this time, the view shows a single column containing the object
information.
View Toolbar Items
The toolbar items may be used to control the heap dump view.
 Take Snapshot
The take snapshot item will take a snapshot of the objects currently
being held in the profiled application's heap and display the results in
the view.